Figure 1: Relationship between the calculated values of Q for the steels studied in this work and its C and Mn contents.
- INTRODUCTION
The mathematical modelling of hot strength from strain temperature, degree and rate was and still remains exhaustively being studied for several kinds of steel; in fact, many equations were proposed [1]. This may be due to the remarkable influence of the forming parameters on hot strength, specially temperature [2]. However, knowledge about the effect of alloy elements on hot strength still is scarce and contradictory.
For example, the effect of carbon on hot strength depends significantly on forming conditions. For low values of strain degree, this interstitial element increases the drag tension needed for the migration of dislocations, due to the formation of carbon atmospheres and excess vacancies, raising strain hardening. However, as strain degree increases, this element promotes dynamic recrystallization, as it increases the diffusivity of vacancies. This decreases strain hardening and, in consequence, the magnitude of hot strength. Such phenomena can explain the contradictory relationship between carbon content and activation energy for hot deformation Q observed in several papers [3-5]
Another interstitial element frequently present in steels, nitrogen, normally shows a narrow content range. So, its influence generally is not great [2]. However, in Ti microalloyed steels, the presence of this element can promote the precipitation of TiN, refining the initial austenitic grain size and thus leading to an indirect increase of hot strength up to 20%. This is particularly noticeable when steel is reheated to high temperatures before hot forming [6].
The hardening effect derived from solid solutions of substitutional elements fundamentally depends on the difference between the atomic diameters of the element and iron [2]. So, the hardening effect decreases according to the following sequence: niobium, titanium, vanadium, molybdenum, silicon, manganese and chromium. This effect is greater than expected when there is a combination of elements in the alloy, due to synergic effects [7].
However, Nb can promote a considerable increase in hot strength due to the supression of austenite recrystallization during forming below the so-called temperature of no-recrystallization (Tnr) [2]. Cu has a similar effect, but its influence is weaker than Nb [8].
Some authors tried to verify the effect of the carbon equivalent (Ceq) parameter on hot strength, but no precise correlation was achieved [9,10].
The influence of alloy elements on Ar3 also influences the magnitude of hot strength. It is well known that hot strength increases as temperature decreases, but, in the vicinity of Ar3, it momentarily decreases, as ferrite is softer than austenite at the same temperature. This local decrease, however, is less pronounced in steels with higher Mn, as this element reduces the kinetics of the ferrite transformation [2,11].
The influence of alloy elements on the hot deformation activation energy Q is not always clear, due to the differences in the experimental methodology observed in the literature. Roughly speaking, the increase of Mn and Nb tends to raise the magnitude of Q [12,13]. The presence of different alloy elements in the industrial alloys studied in the literature makes difficult the determination of the real effect of specific elements on Q.
The precision of equations for the calculation of hot strength from chemical composition is lower than mathematical models developed for specific alloys [1]. The first equation that included the effects of chemical composition on hot strength was developed by Ekelund, which included the contents of C, Mn and Cr as parameters. Another classical model is the equation of Misaka; its first version only considered the effect of C in hot strength; a second version included the influence of Mn, V, Mo and Ni, besides the effect of the transformation of austenite in ferrite. This last effect was also considered in the model of Shida which, for its turn, only considered the effect of C among the alloy elements [2].
The Hajduk equation [14] for calculation of hot strength S,
The lack of data and reliable mathematical models which account for the influence of alloy elements on hot strength motivated the development of a research work for this purpose, specifically for the low carbon and microalloyed steels processed at the Plate Mill of Companhia Siderúrgica Paulista - COSIPA. Besides the development of such mathematical model, one additional objective of this work was to rank the hot strength of these steels, in order to assess its "rollability".
- EXPERIMENTAL PROCEDURE
The hot strength of the most frequently processed steels at COSIPA plate mill was determined through isothermal torsion tests performed at the Federal University of Săo Carlos, Brazil. Nine steels were studied; three of them were low carbon steels, whereas six alloys were microalloyed. Their chemical compositions can be seen at Table I.
| Steel | C | Mn | Si | Al | Cr | Cu | Nb | V | Ti | N |
|---|---|---|---|---|---|---|---|---|---|---|
| C1 | 0.09 | 0.53 | 0.18 | 0.029 | - | - | - | - | - | 0.0047 |
| C2 | 0.15 | 0.90 | 0.21 | 0.039 | - | - | - | - | - | 0.0053 |
| CMn | 0.16 | 1.48 | 0.36 | 0.039 | - | - | - | - | - | 0.0048 |
| Nb | 0.18 | 1.34 | 0.30 | 0.025 | - | - | 0.033 | - | - | 0.0074 |
| NbTi1 | 0.14 | 1.11 | 0.30 | 0.044 | - | - | 0.020 | - | 0.015 | 0.0054 |
| NbTi2 | 0.14 | 1.34 | 0.23 | 0.035 | - | - | 0.033 | - | 0.014 | 0.0048 |
| NbTiV | 0.12 | 1.50 | 0.31 | 0.038 | - | - | 0.047 | 0.051 | 0.020 | 0.0064 |
| NbCrCu1 | 0.16 | 1.03 | 0.41 | 0.029 | 0.54 | 0.23 | 0.025 | - | - | 0.0107 |
| NbCrCu2 | 0.13 | 0.99 | 0.38 | 0.042 | 0.50 | 0.22 | 0.014 | - | - | 0.0095
|
Steel samples, cut from plates, were previously austenitized at 1100 oC during ten minutes. A mixture of argon and hydrogen was used as protective atmosphere. After that, they were cooled until they reached the test temperature. At this moment, deformation was applied in the specimen, up to a strain degree of 2.0. The tests were carried out under temperatures of 1100, 1000, 900 and 800oC, and strain rates of 0.5, 1.0 and 5.0 s-1.
Data got from these tests was processed in order to develop a relationship between chemical composition and hot strength. The following parameters were calculated: activation energy of hot deformation Q, according to the procedure of UVIRA & JONAS [15]; hot mean flow stress, considering all forming conditions; and the constants S0, a, b and c of the equation of Hajduk. The effect of alloy elements over these parameters was statistically determined, through the Pearson matrix, stepwise multiple correlation and multiple principal components analysis, using the Systat software.
Finally, a neural network for the prediction of hot strength from chemical composition of steels and hot forming parameters was developed. This perceptron had 13 neurons in the input layer (strain temperature, degree and rate; carbon, manganese, silicon, aluminum, copper, chromium, niobium, titanium, vanadium and nitrogen contents). The total number of neurons in the hidden layers was 27, making an analogy with the theorem of Hecht-Kolmogorov [16]; they were uniformly distributed in three hidden layers, each one with 9 neurons. The output layer, obviously, had only one neuron, with the predicted value of hot strength. The process of conception, training and test of this neural network was carried out using the NeuralWorks software. The training step of the neural network was performed using 80% of the available data; the remaining 20% was reserved to test its performance.
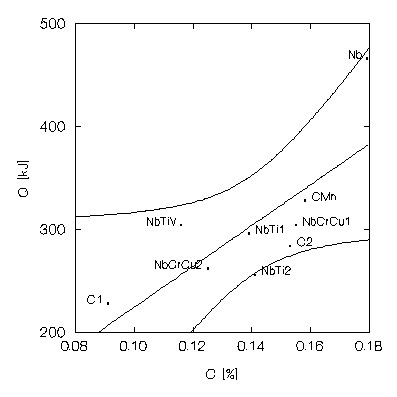
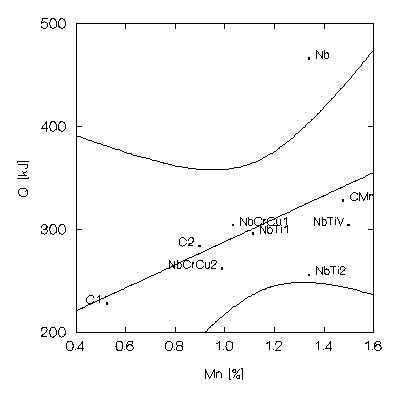
The values of Q calculated for the steels studied in this work, showed in Figure 1, are within the range of values typical for low carbon and microalloyed steels, even though the value corresponding to the Nb steel was somewhat higher, as can be seen in Table II. The statistical analysis showed that Q is significantly influenced by the C and Mn contents. The respective Pearson correlation coefficients were 0,760 and 0,518. The positive correlation between C and Q was unexpected, according to the literature [5]. However, there is some positive correlation between this element and other alloy elements in the steels studied in this work; in fact, the correlation coefficient between C and Mn contents is 0,503. Hence, the effect of C over the values of Q detected in this work can not be considered as being due exclusively to this element.
Figure 1: Relationship between the calculated values of Q for the steels studied in this work and its C and Mn contents.
| Steel | Q [kJ/mol] |
|---|---|
| C1 | 228 |
| C2 | 284 |
| CMn | 328 |
| Nb | 466 |
| NbTi1 | 296 |
| NbTi2 | 256 |
| NbTiV | 304 |
| NbCrCu1 | 304 |
| NbCrCu2 | 262
|
For its turn, the values of hot mean flow stress - see figure 2 - showed some correlation with the Nb and Ceq contents of steel, with Pearson correlation coefficients of 0,504 and 0,693, respectively. This later correlation is not confirmed by the literature [9], but it is insufficient to be used as a good prediction model for hot strength in function of the chemical composition of steel.
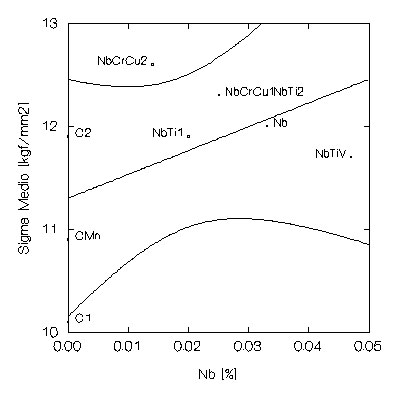

Figure 2: Relationship between the hot mean flow stress for the steels studied in this work and its Nb and Ceq contents.
The correlations between Q and the hot mean flow stress with chemical composition were different. So, ranking steels according to these two parameters will lead to different results. It should be noted, however, the value of Q is determined only from the peak value of hot strength and strain rate available for each test, while the hot mean flow stress is calculated from a broader range of values from the curve stress versus train. This fact renders this last parameter less prone to experimental errors, as it is determined from a significantly greater number of data records.
The statistical analysis of the effect of alloy elements in the parameters of the Hajduk equation showed that C once more was the most influencing element, specially over S0 (r=0.714) and a (r=0.762), with some effect over b (r=-0.592) and c (r=-0.564), as shown in figure 3. This finding is confirmed by the literature: the increase of C content leads to higher values of basic hot strength and enhance the temperature effect on hot strength, but reduce the effect of strain degree and strain rate [4]. It was also verified that Mn, Si and Nb also reduce the effect of strain rate on hot strength, with Pearson correlation coefficients of -0.636, -0.580 and -0.542, respectively.
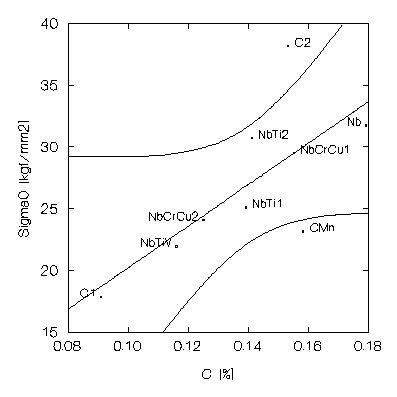

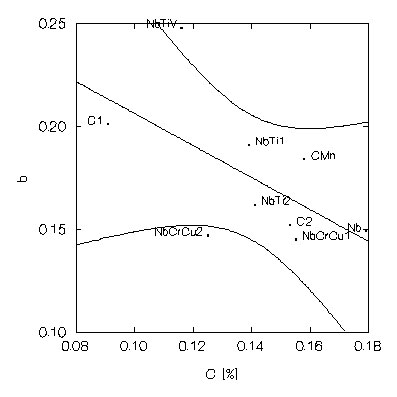
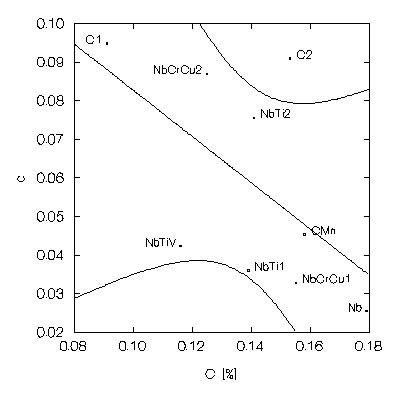
Figure 3: Effect of C on the parameters of the Hajduk equation.
Table III shows the performance of linear equations developed using stepwise multiple correlation between the parameters of Hajduk equation and the chemical composition of the steels. Very good results were got regarding the prediction of basic hot strength (S0) and the constant of the exponential function of the temperature (a); a reasonable relation was also achieved for the exponent of the strain degree (b). However, results got for strain degree were not statistically significant. This prevented the use of this approach for the development of a precise prediction model for hot strength from the chemical composition and parameters of the hot forming process.
| Elements | r | Standard Error | Confidence [%] | |
|---|---|---|---|---|
| S0 | C(+), Si(-), Cu(+), V(+), Al(+) | 0.994 | 0.781 | 99.8 |
| a | C(+), Si(-), Cu(+), Al(+), V(+) | 0.993 | 0.001 | 99.8 |
| b | V(+), Ceq | 0.803 | 0.018 | 99.2 |
| c | Mn(-) | 0.404 | 0.066 | 93.4
|
The failure of the development of a model for the prediction of hot strength from chemical composition and hot forming parameters from the values of Q, hot mean flow stress and parameters of Hajduk equation paved the way for the application of neural networks in this problem. There are already some examples of this application in the literature [10].
The neural network developed in this work allowed the prediction of hot strength from the C, Mn, Si, Al, Cr, Cu, Nb, V, Ti and N contents of steel, as well its hot forming parameters (strain temperature, degree and rate). After testing with 20% of the available data, not "shown" to the perceptron during its training step, this model revealed a very good performance: Pearson correlation coefficient of 0.939 and a standard error of 11.8 MPa. This precision is inferior to the performance of hot strength models developed for specific alloys [1], but is very good for a model including chemical composition. This trained neural network was converted in a simple BASIC subroutine for use in mathematical models for off-line calculation of hot rolling load and pass schedule for the COSIPA plate mill.
A neural network is as good as the data used during its training step. The alloys studied in this work were selected according to its participation in the productive mix of the plate mill. Unfortunately, this criterion was not adequate from a scientific standpoint. For example, as told before, Mn content of the alloys used in this paper tended to be proportional to C content. So, the neural network developed in this work probably will not yield results so precise for steels with high C and low Mn contents, for example, as the neural network did not "learn" about this specific kind of alloy. This situation only can be corrected adding more hot strength information to its training data set. So, further hot torsion tests must be carried out, preferably using judicious experiment planning, in order to refine this model.
The main objective of this work was to rank steels processed in a plate mill according to its hot strength and to develop a model to predict this property from steel chemical composition and hot forming parameters. The conclusions derived from this development are as follows:
The fundamental support during the conception and preliminary activities of this project by Celso Gomes Cavalcanti, Marcos Antonio Stuart and José Herbert Dolabella da Silveira, from COSIPA, must be acknowledged. The author is also grateful to the Prof. Dr. Oscar Balancin and his staff, from the Materials Engineering Department of the Federal University of Săo Carlos, for the execution of the hot torsion tests and the valuable suggestions done.

 |
Last Update: 06 January 2000 | |
| © Antonio Augusto Gorni |